Inspecting a Dashboard
Inspecting a Dashboard
From this point on, you can access this dashboard by these steps:
1. Click on the folder icon.
![]()
2. Click on the the dashboard name.
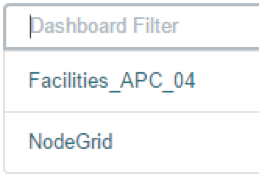
If needed, you can search for the dashboard by entering a search expression in the dashboard filter.
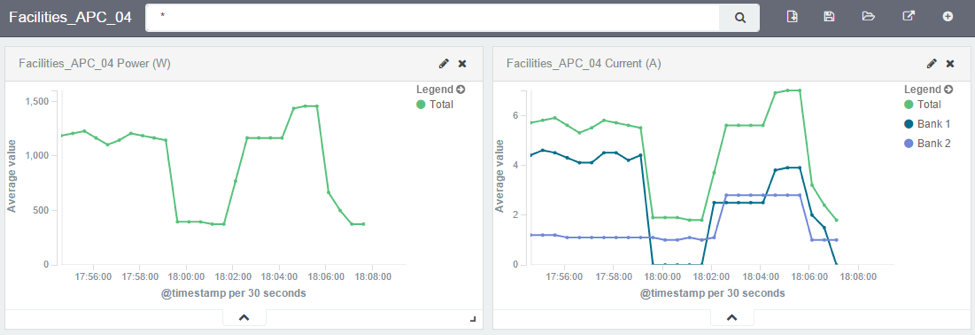
3. The selected dashboard will show up.
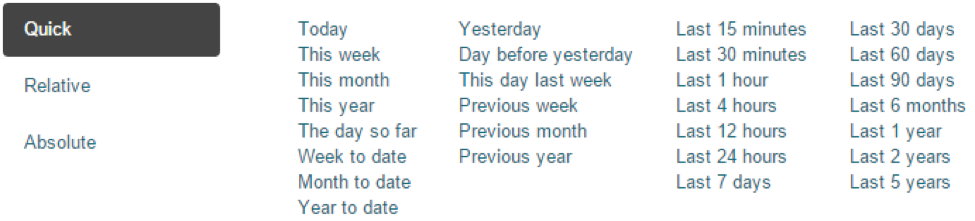
4. You can change the time frame by clicking on the clock icon.
5. And selecting the new time frame.
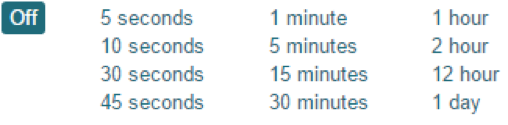
6. You may also want to set automatic refresh by clicking on the clock icon and then on the auto-refresh icon.
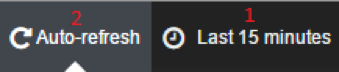
7. And selecting how frequent you want the refresh to be done.
Related Articles
NodeGrid Monitoring Aggregation Settings
Here is how to configure a monitoring aggregation. 1) Make sure you have a monitoring license installed. If you don't have one, add one via System > License 2) Make sure you have the devices you want to aggregate configured and monitoring is enabled. ...Enabling Monitoring
Perform the steps below to enable monitoring for a device, using the interface of your choice, either the CLI or the web. Using the CLI Go to the device’s management settings: cd /settings/devices/<device_name>/management/ Configure monitoring for ...Steps to create a monitoring dashboard of a PDU
Please, follow the instructions of the following articles, in this order: 1. Enabling Monitoring 2. Exploring Data Points 3. Creating a Visualization 4. Creating a Dashboard 5. Inspecting a Dashboard 6. NodeGrid Monitoring Aggregation Settings 7. ...Customizing a Monitoring Template
There are a number of pre-existing monitoring templates, and if any of them satisfies your needs you can skip to the next section. All templates are text files located under the directories /etc/collectd.templates/snmp /etc/collectd.templates/ipmi ...Creating a Dashboard
We can now create a dashboard and add visualization to it, so we can easily access the visualizations that share the same context. 1. Click on Dashboard. 2. Click on the new dashboard icon. 3. Click on the add visualization icon. 4. This will show ...